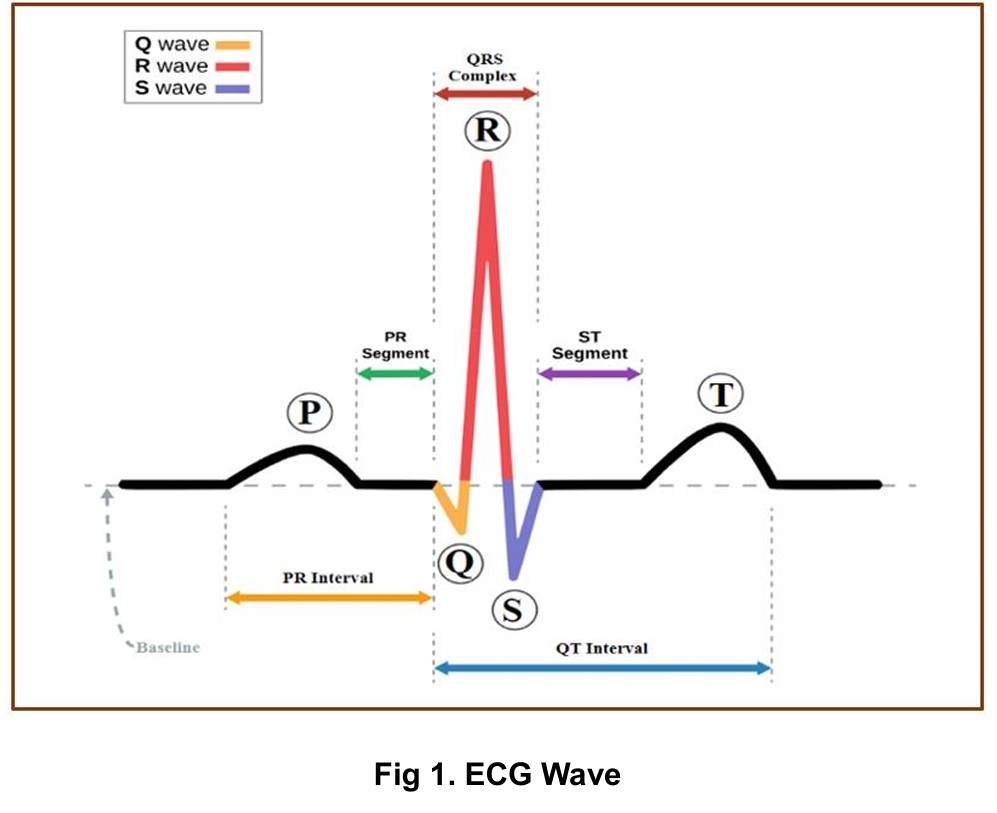
ECG Wave Components (P, Q, R, S, T)
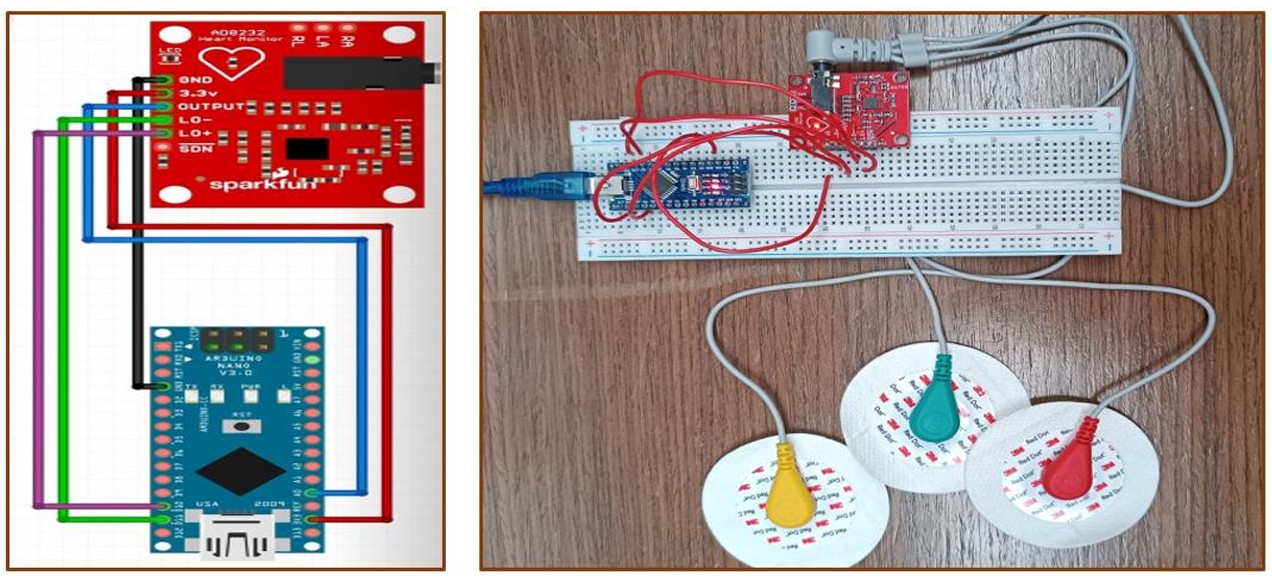
Arduino Nano with AD8232 ECG Sensor
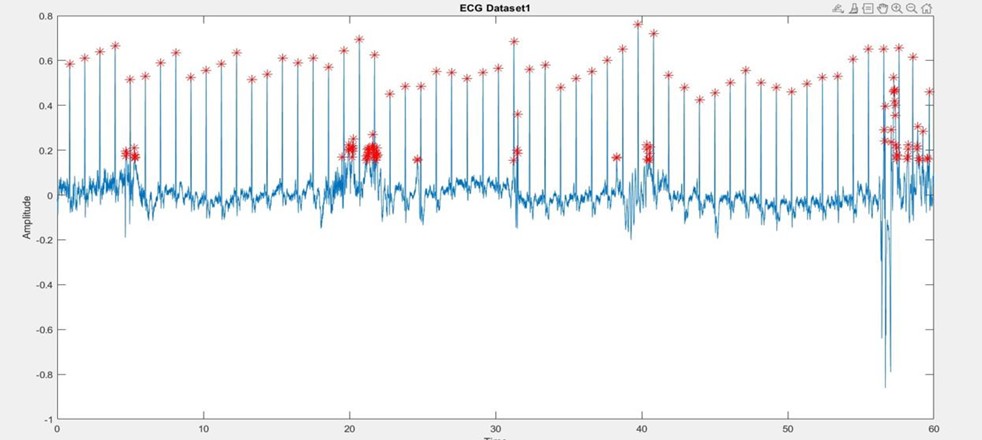
Real-Time ECG Signal in MATLAB
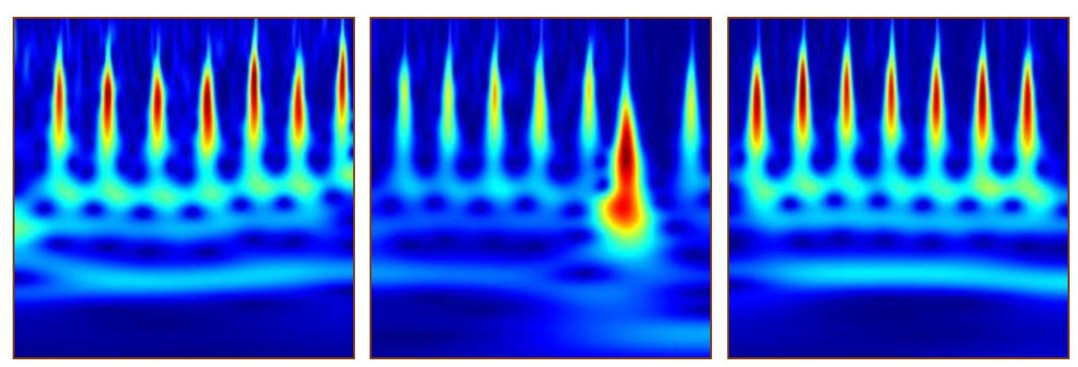
Converted Images from dataset for CNN
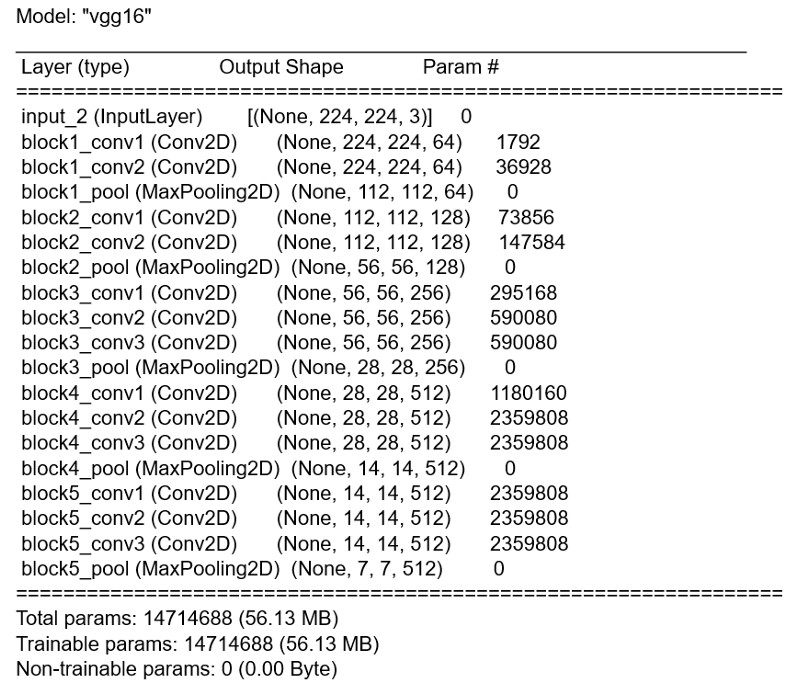
VGG16 Transfer Learning Architecture
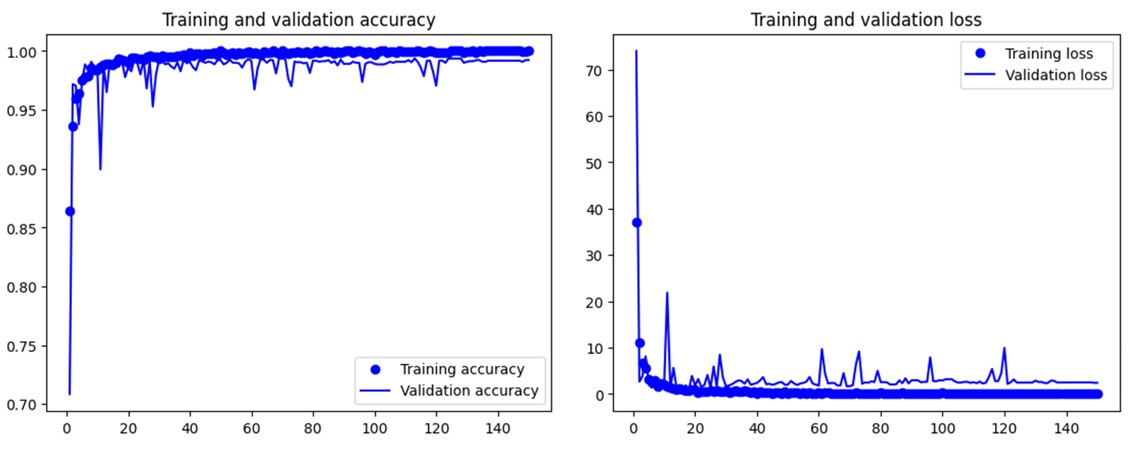
Arrhythmia Classification Results
The modern medical field, especially for the treatment of heart disease, relies heavily on electrocardiogram (ECG) equipment to detect abnormalities and illnesses. An electrocardiogram records the electrical signals in the heart through a painless examination for detecting heart problems and monitoring heart health. Atrial fibrillation (AFib or AF) is defined as an irregular and often very rapid heart rhythm that can lead to blood clots in the heart, increasing the risk of stroke, heart failure, and other heart-related complications.
Each ECG cycle comprises five waves (P, Q, R, S, and T) corresponding to different periods of the heart's activity:
This project addresses these challenges by developing a cost-effective, portable ECG monitoring system using the AD8232 sensor and Arduino Nano microcontroller, coupled with MATLAB signal processing and deep learning validation for automated cardiac condition assessment.
This project delivers a complete ECG monitoring system that empowers patients to monitor their heart rate and assess cardiac conditions conveniently at home or on the go. The system combines hardware signal acquisition with sophisticated software processing and machine learning validation.
ECG Sensor Module: AD8232 single-lead heart rate monitor for signal conditioning
Microcontroller: Arduino Nano for analog-to-digital conversion and serial communication
Electrode Configuration: Three disposable Ag/AgCl gel electrodes placed on:
• Right Arm (RA) - Red electrode
• Left Arm (LA) - Yellow electrode
• Right Leg (RL) - Green electrode (ground reference)
Breadboard Circuit: Stable connections for AD8232 to Arduino Nano with proper grounding
Power Supply: USB-powered through Arduino Nano (5V logic)
Arduino IDE Implementation: Custom code for reading analog input from AD8232 output pin
Sampling Rate: Continuous analog readings at high frequency for accurate ECG capture
Serial Communication: 9600 baud rate for transmitting ECG data to computer
Lead-Off Detection: LO+ and LO- pins monitor electrode contact quality
Real-Time Visualization: Arduino IDE Serial Plotter displays live ECG waveform
Limitations Addressed: Serial Plotter only shows latest 500 values, necessitating MATLAB integration for comprehensive analysis
Hardware Support Package: MATLAB Support Package for Arduino Hardware enables direct communication
Real-Time Data Acquisition: readVoltage() function captures analog values from A0 pin
Signal Normalization: Data normalized between -1 and +1 using min-max normalization:
Formula: X_normalized = 2*(X - X_min)/(X_max - X_min) - 1
Continuous Plotting: 1000 iterations (approximately 60 seconds) for comprehensive heart rate analysis
Dynamic Visualization: Real-time plot updates with detected R-peaks highlighted in red
Peak Finding: MATLAB's findpeaks() function identifies local maxima in normalized signal
Threshold Setting: MinPeakHeight = 0.5 filters noise and isolates R-peaks
Peak Storage: Arrays maintain all detected peak values and time indices
Visual Marking: Red asterisks (*) overlay detected R-peaks on ECG plot
Adaptive Detection: Minimum 3-sample window ensures reliable peak identification
Oscilloscope Verification: Parallel oscilloscope connection validates MATLAB timing
Latency Compensation: Accounts for signal transmission delay through hardware chain
Scaling Factor Derivation:
• Oscilloscope measurement: R-R interval = 690ms (actual time)
• MATLAB plot: R-R interval = 32 units (x-axis difference)
• Scaling factor = 690ms / 32 = 21.5625 ms per unit
R-R Interval Array: Calculates absolute differences between consecutive peak indices
Mean R-R Interval: Average of all R-R intervals provides stable heart rate estimate
BPM Formula: BPM = 60,000 / (Mean R-R interval × Scaling Factor)
Classification Logic:
• Normal: 60-100 BPM with regular rhythm
• Atrial Fibrillation: 101-200 BPM indicating irregular heart rhythm
• Error: Values outside ranges prompt re-measurement
Real-Time Feedback: Immediate display of BPM and cardiac condition assessment
Mean Absolute Difference Approach: Robust to signal noise from 3-electrode placement
To verify the robustness and accuracy of our R-peak detection and BPM calculation algorithm, we tested it on established medical datasets from PhysioNet's PhysioBank ATM database.
Source: MIT-BIH Normal Sinus Rhythm Database
Signal Characteristics: Regular heartbeat pattern with consistent R-R intervals
Processing: CSV data imported into MATLAB, processed with identical peak detection algorithm
Results: BPM = 89, Classification: Normal
Validation: Algorithm correctly identified regular rhythm and appropriate BPM range
Source: MIT-BIH Arrhythmia Database
Signal Characteristics: Irregular rhythm with variable R-R intervals, elevated heart rate
Processing: Applied same findpeaks() threshold and BPM calculation formula
Results: BPM = 150, Classification: Atrial Fibrillation
Validation: Successfully detected AF condition based on elevated BPM and irregular intervals
To provide additional validation and enable automated arrhythmia classification, we implemented a Convolutional Neural Network using transfer learning with VGG16 architecture.
Database: MIT-BIH combined dataset including:
• MIT-BIH Arrhythmia Database
• MIT-BIH Normal Sinus Rhythm Database
• BIDMC Congestive Heart Failure Database
Data Structure: 162 × 65,536 matrix (162 patients, 65,536 samples each)
Sampling Rate: 128 Hz, 1-hour duration per recording
Classes Selected: ARR (Arrhythmia) and NSR (Normal Sinus Rhythm)
Subset Creation: 30 ARR + 30 NSR = 60 total recordings for focused binary classification
Segmentation: Each recording divided into 500-point segments
Total Segments: 60 recordings × 125 segments/recording = 7,500 segments
Continuous Wavelet Transform (CWT):
• Applies time-frequency analysis to capture dynamic frequency characteristics
• Reveals frequency components at different time points
• Ideal for signals with time-varying spectral content like ECG
Image Generation: CWT coefficients converted to 256-color RGB images (224×224 pixels)
Class Distribution: 3,750 ARR images + 3,750 NSR images = 7,500 total images
Training Set: 5,250 images (70%)
Validation Set: 2,206 images (29%)
Test Set: 44 images (1%)
Balance: Equal representation of ARR and NSR in each split
Base Model: VGG16 pre-trained on ImageNet
Model Configuration:
• Input shape: (224, 224, 3) RGB images
• Include_top = False (remove original classifier)
• Weights = "imagenet" (transfer learning)
• Base_model.trainable = False (freeze convolutional layers)
Custom Classifier Layers:
1. Flatten layer: (7, 7, 512) → 25,088 features
2. Dense layer: 256 neurons with ReLU activation
3. Dropout layer: 0.5 dropout rate for regularization
4. Output layer: 1 neuron with sigmoid activation (binary classification)
Total Parameters: 14,714,688 (56.13 MB)
Loss Function: Binary crossentropy
Optimizer: RMSprop
Metrics: Accuracy
Training Epochs: Tested at 150, 300, and 1000 epochs
Feature Extraction: Pre-computed features from frozen VGG16 base
1. Patient electrodes placed on both arms and right leg
2. AD8232 conditions raw bioelectric signals (filtering, amplification)
3. Arduino Nano samples analog output at A0 pin
4. Serial transmission at 9600 baud to computer
1. Arduino object creation and port connection
2. readVoltage(a, "A0") captures analog values in real-time
3. Min-max normalization scales data to [-1, 1] range
4. Real-time plotting with 1000-iteration loop (60 seconds)
1. findpeaks() identifies local maxima with 0.5 threshold
2. Peak values and indices stored in arrays
3. Red asterisks overlay detected R-peaks on plot
4. Visual confirmation of detection accuracy
1. Calculate R-R intervals (time between consecutive peaks)
2. Apply oscilloscope-calibrated scaling factor (21.5625 ms/unit)
3. Compute mean R-R interval for stability
4. BPM = 60,000 / (mean_RR × scaling_factor)
1. Compare calculated BPM against thresholds
2. Normal: 60-100 BPM
3. Atrial Fibrillation: 101-200 BPM
4. Display classification result to user